
On June 23, 2016, Britons headed to the polls to vote on whether to stay in the European Union.
A shock result emerged overnight: the electorate had voted to leave the bloc by 52% to 48%. The pound tanked. London’s FTSE 100 tumbled. Then-Prime Minister David Cameron — who had called the referendum and led the campaign for the Remain vote — resigned.
Since then, the U.K. haggled for a deal, as Cameron’s successor, Theresa May, failed to pass a proposal three times before stepping down. Brexit was eventually delivered by Prime Minister Boris Johnson in 2020.
The Brexit campaign promised to “take back control” of immigration, free up more money for the country’s health service, and forge trade deals with the rest of the world.
A decade later, Brexit still looms over life in Britain. Here’s how the U.K.’s economic and political scene has fared since then, in charts:
How Brexit affected U.K. growth

The U.K. economy has largely failed to experience a post-Brexit boost after upending ties with its largest trading partner.
While shocks such as the coronavirus pandemic in 2020 and Russia’s invasion of Ukraine in 2022 hit growth globally, Stanford professor Nicholas Bloom estimates that by 2025, Brexit had reduced the U.K.’s GDP by 6-8%.
He wrote that the negative impacts “reflect a combination of elevated uncertainty, reduced demand, diverted management time, and increased misallocation of resources from a protracted Brexit process.”
How U.K. immigration changed after Brexit

The Vote Leave campaign pledged to take back control of the U.K.’s migration policy, but its departure from the bloc had unintended consequences. The U.K. now has net emigration with EU countries, but migration from non-EU states surged amid work supply shortages, an increase in international students, and emergency visa schemes extended to countries such as Ukraine.
On the other hand, fewer Europeans are moving to the U.K., and net migration from the bloc has gone into reverse.
“EU net migration subsequently turned negative in 2022, as the post-Brexit immigration system greatly reduced opportunities for EU citizens to move to the UK,” the Migration Observatory wrote in a May briefing.
“Take-up of work visas among EU citizens has been relatively low since Brexit.”
Sterling

One of the clearest indicators of the impact of Brexit is the value of sterling, which crashed following the vote and is yet to regain its pre-referendum highs against both the euro and the dollar. The pound has typically operated around 10% below its June 2016 value, according to Convera.
Convera found that GBP/EUR has averaged €1.16 since the referendum, down from €1.27 in the decade before, with sterling spending 98% of trading since the Brexit vote below €1.20.
This made foreign goods and assets immediately more expensive for U.K. citizens, impacting the cost of living as the country is a significant importer of food, energy and materials.
What happened to the FTSE 100 and FTSE 250
The performance divergence between the large-cap, multinational FTSE 100 and the more domestically-oriented FTSE 250 also paints a muted picture for London’s capital markets.
“Beneath the surface, the UK stock market still bears the scars of a decision that has weighed on both business and investor confidence,” Chris Smith, U.K. growth equities investment manager at Jupiter, told CNBC.
“The FTSE 100, with its global revenue exposure and favorable sector composition, has significantly outperformed the more domestically oriented FTSE 250. Sterling weakness, FX-led inflation and a higher cost of capital have all contributed to a more challenging backdrop for UK-focused businesses,” he added.
Neither index has kept pace with the eyewatering gains experienced in U.S. equity markets, which have enjoyed a prolonged bull run fueled by technology and AI stocks.
“The UK stock market is little changed to ten years ago,” said Mark Preskett, portfolio manager at Morningstar. “The FTSE’s dominant stocks a decade ago remain our most successful companies.”
“If you contrast this to the US market, you can see a more dynamic list of companies and an index that has seen real change.”
How Brexit changed U.K.-EU trade

The EU remains the U.K.’s largest trading partner, accounting for over €800 billion of imports and exports.
In 2025, the EU accounted for 41% of the UK’s exports and 50% of U.K. imports.
A new trade deal between the two parties was signed on Jan. 1 2021, preventing either side from introducing tariffs or quotas.
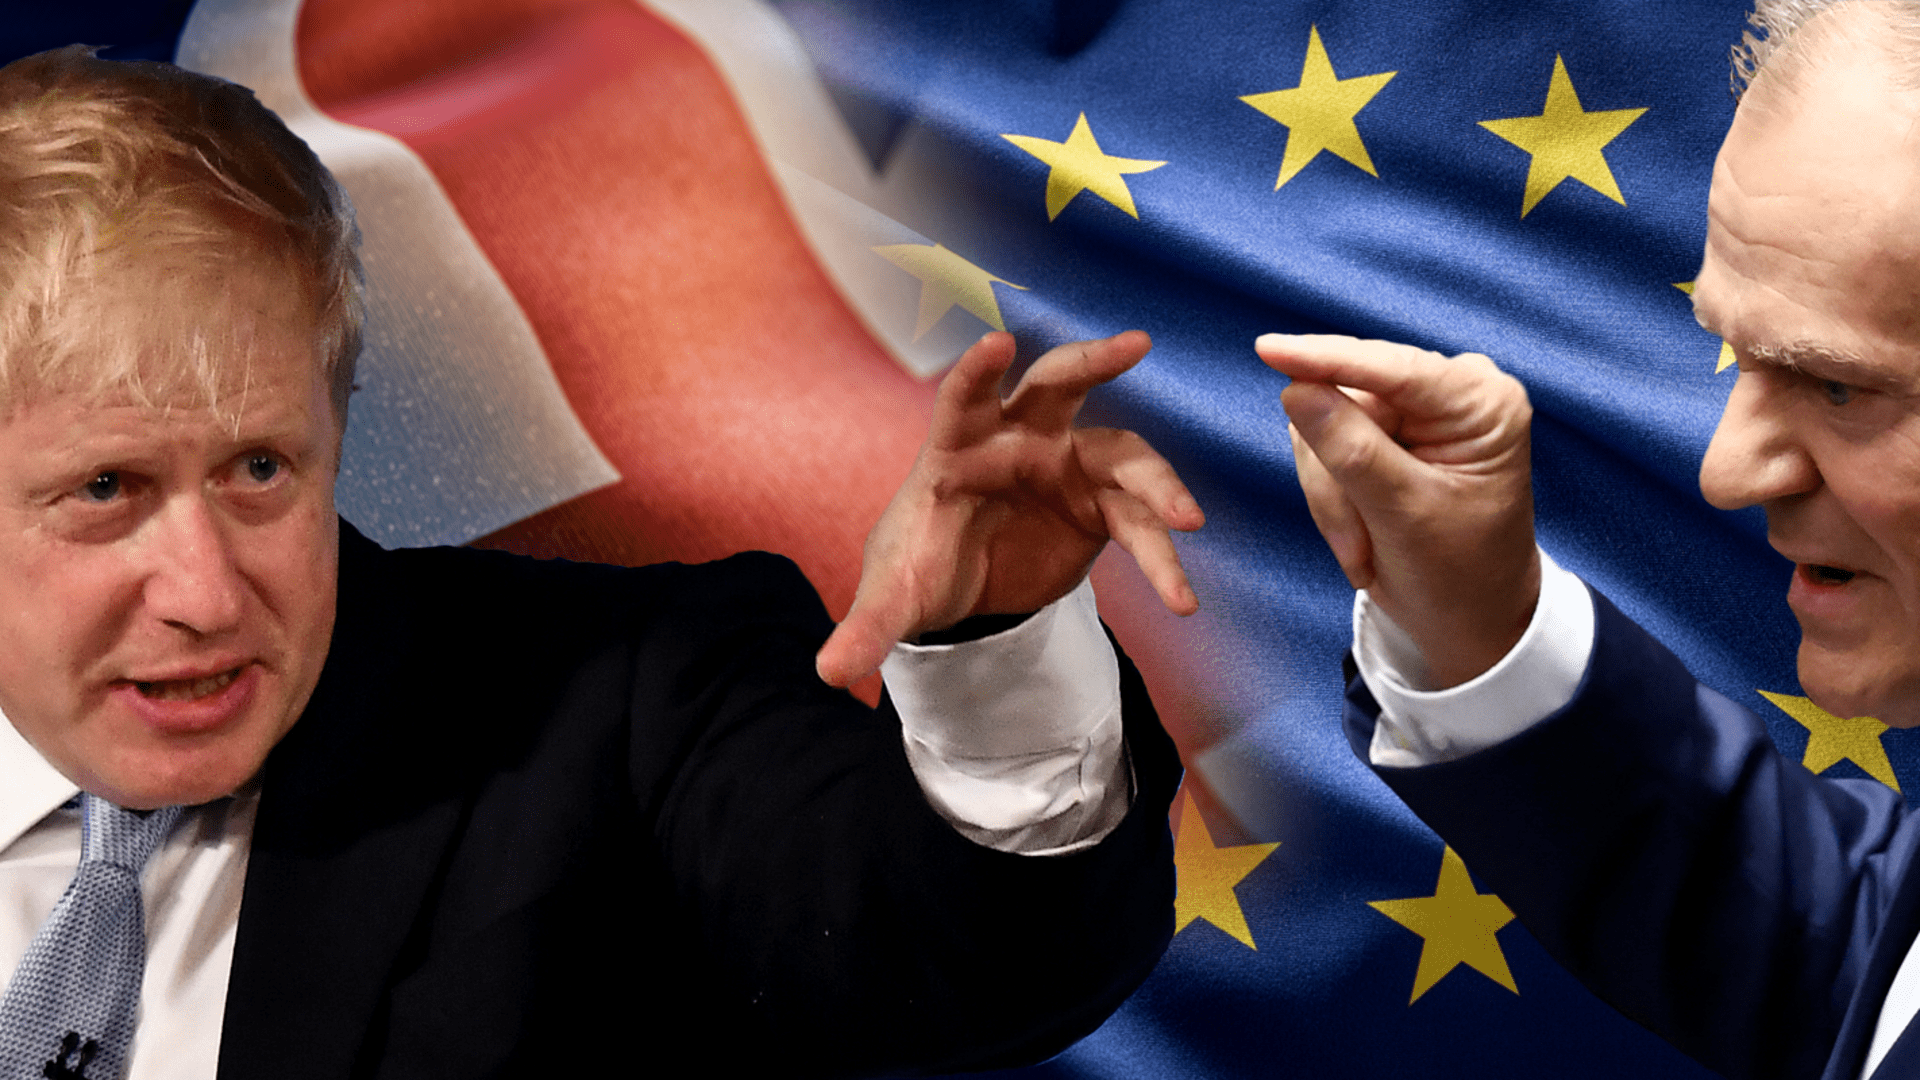
Prime ministers
When Cameron resigned the morning after the Brexit vote, he’d been prime minister for six years. His predecessor, Gordon Brown, was in office for three years. Before Brown, Tony Blair was prime minister for a decade.
Since the referendum, no prime minister has lasted longer than three years — and one lasted just 49 days.
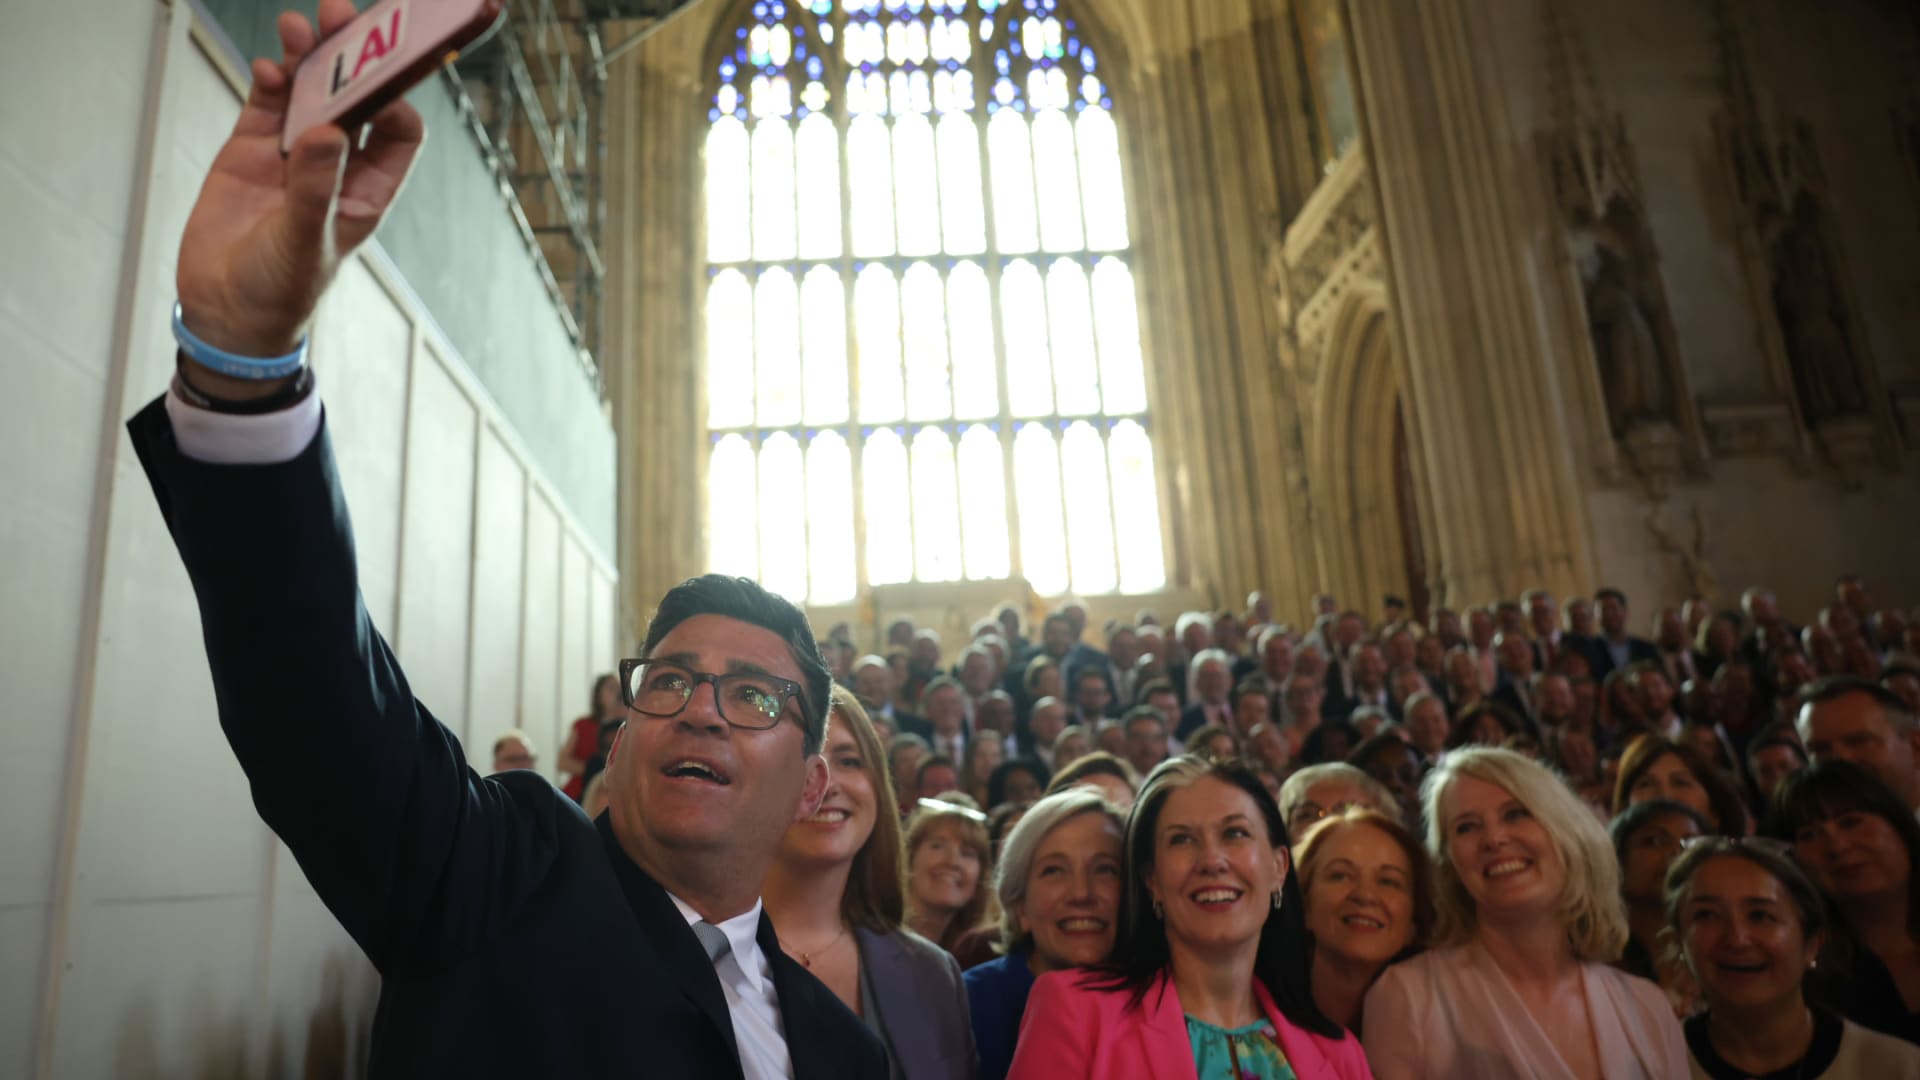
Prime Minister Keir Starmer tried to rebuild the country’s ties with Europe but resigned on Monday as he faced a leadership challenge from rival Andy Burnham, clearing the way for the seventh prime minister in a decade.
— CNBC’s Bryn Bache also contributed to this report.